Welcome to WordPress. This is your first post. Edit or delete it, then start writing!
One Response
Hi, this is a comment.
To get started with moderating, editing, and deleting comments, please visit the Comments screen in the dashboard.
Commenter avatars come from Gravatar.
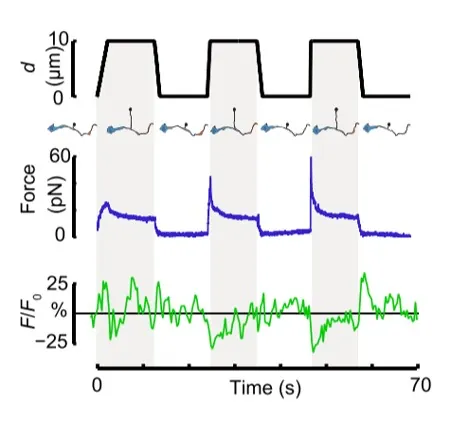
Time dependence of trap position (top), force signal (middle) and Ca2+ fluorescence signal (bottom) recorded during a membrane tether pulling experiment. The force and Ca2+ ion channel activity signals exhibit negative correlation.
Fig. 2
Force and displacement data for two beads stimulated at frequencies of 4 Hz and 0.25 Hz. The progressive reduction of the beads displacement is in concomitancy with an increase of the applied force and loading rate.
Fig. 1
Schematic representation of the optical tweezers experiment. A fibronectin-coated bead is trapped, brought into contact with the cell membrane and stimulated with oscillations at different frequencies.
Fig.2
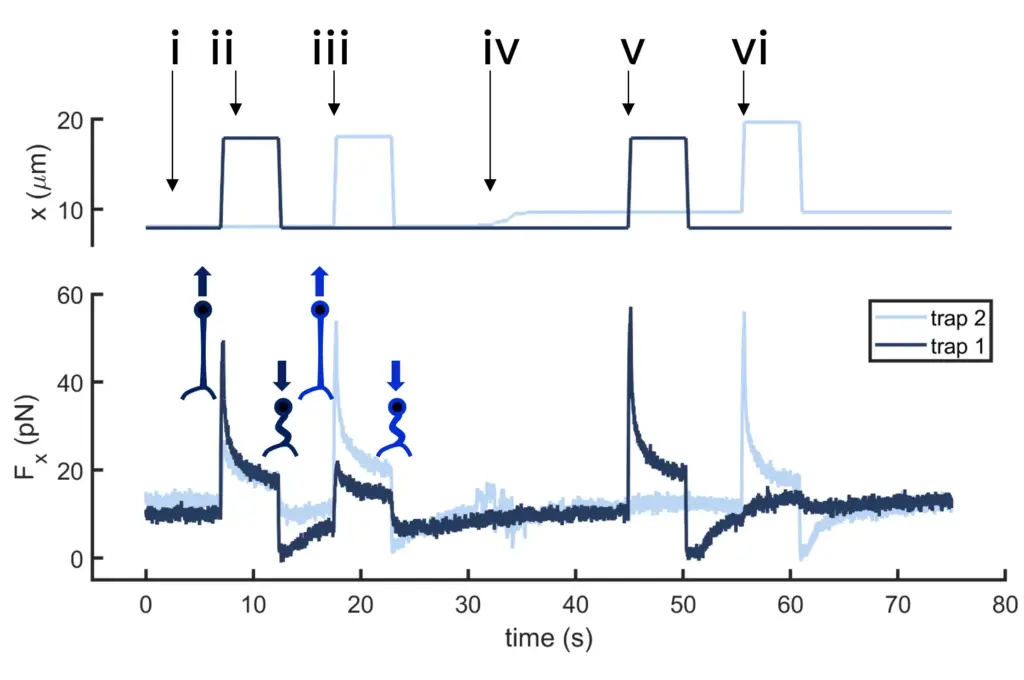
Time dependence of trap 1 and trap 2 position (top) and force (bottom) data along the different steps of the described dual tether pulling experiment.
Fig.1
Confocal video of the described dual tether pulling assay performed on a neuron axon. Courtesy of M. Krieg lab (ICFO).
Fig. 1
Time dependence of trap position (top), force signal (middle) and Ca2+ fluorescence signal (bottom) recorded during a membrane tether pulling experiment. The force and Ca2+ ion channel activity signals exhibit negative correlation.
Video 1
Confocal video showing a DVA neuron Ca2+ ion channel activity in a dynamic optical trapping assay. The pulling rate applied to the membrane tether is progressively increased. Scale bar = 5µm. Acquired at 10Hz.

Hi, this is a comment.
To get started with moderating, editing, and deleting comments, please visit the Comments screen in the dashboard.
Commenter avatars come from Gravatar.